--%>

Derive the long-run aggregate supply curve

For a hypothetical economy, suppose the full employment level of real output (Q) will be $250 and the price level (P) firstly is 100. Employ the short-run aggregate supply schedules below to answer the questions that follow:

120_short-run aggregate supply schedules.png

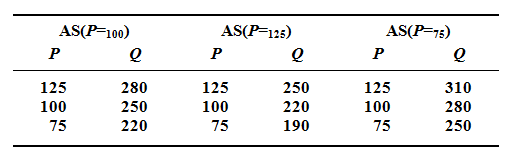
Demonstrate the circumstances explained in parts a and b on graph paper, and derive the long-run aggregate supply curve.

E

Expert

Verified

Short-run AS: P1 = 100; P2 = 125; P3 = 75; and Q1 = $250; Q2 = $280; and Q3 = $220. Long-run aggregate supply = Q1 = $250 at each of the three price levels.

   Related Questions in Finance Basics

  • Q : Define May Revision May Revision : The

    May Revision: The annual update to the Governor’s Budget having a revised estimate of General Fund revenues for the present and ensuing fiscal years, any proposals to adjust expenditures to reflect the updated revenue estimates,

  • Q : Why is replacement value of assets

    Why is the replacement value of assets method not used generally to value complete businesses?The replacement value of assets method is not frequently applied to complete business valuations since it is frequently very hard to locate similar ass

  • Q : Reducing payroll costs It is likely

    It is likely that in the next few years, employers will face incresing pressures to reduce their payroll costs. critically evaluate the range of ways by which payroll costs can be reduced whilst taking into account the need to maintain a focus on the

  • Q : Describe the notion of political

    Normal 0 false false

  • Q : Increased common stock cash dividend

    Do you trust an increased common stock cash dividend can send any signal to the common stockholders? If so, what signal might it send? An increase in cash dividends is frequently seen as a positive signal. A company would be unlikely to raise

  • Q : Define Federal Fiscal Year Federal

    Federal Fiscal Year (FFY): The twelve month accounting period of the federal government, starting on October 1 and ending the following September 30. For illustration, a reference to FFY 2013 means the period starting October 1, 2012 and ending at Sep

  • Q : Explain Transfers Transfers : As

    Transfers: As employed in Schedule 10Rs and fund situation statements, transfers replicate the movement of resources from one fund to the other based on statutory authorization or particular legislative transfer appropriation authority.

  • Q : Describe Treasury bill Describe

    Describe Treasury bill? How risky is it?Treasury bills are short term debt instruments issued through the U.S. Treasury which are sold at a discount and pay face value at maturity.  They are very close to risk-free as they are backed throug

  • Q : Explain Planning Estimate Planning

    Planning Estimate (PE): A document employed to record and monitors those present and budget year expenditure adjustments comprising budget change proposals accepted for inclusion in the Governor's Budget. PEs is broken down by department, character, f

  • Q : Describe risk aversion Describe risk

    Describe risk aversion? Risk aversion is the tendency to ignore additional risk. Risk-averse people will ignore risk if they can, unless they attain additional compensation for letting that risk. In finance, the added compensation is a higher ex