--%>

Depicts shift of the budget line

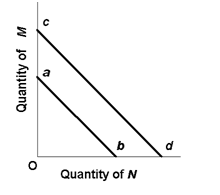
The shift of the budget line from cd to ab in the below  given figure is consistent with: 1) decreases in the prices of both M and N . 2) an increase in the price of M and a decrease in the price of N . 3) a decrease in money income. 4) an increase in money income.

1660_2.png

Can some one help me in above que?

   Related Questions in Microeconomics

  • Q : Problem on Hicks model of collective

    The model of collective bargaining designed by the John Hicks graphically resolves for the level of: (i) Wage rate and length of strike. (ii) Fringe advantages and safety cases on the job. (iii) Wage rates and union dues. (iv) Union control over the w

  • Q : Decreases in market demand of

    Decreased market demand for generic bricks would result in a(n) ___________ in the price of bricks and a(n) ___________ in this brickyard’s profit-maximizing output. (w) increase; decrease. (x) increase; increase. (y) decrease;

  • Q : Lowest possibility for price elasticity

    The price elasticity of demand would possibly be lowest for: (1) Dasani. (2) Deer Park. (3) Aquafina. (4) bottled water. (5) Perrier. Can anybody suggest me the proper explanation for given problem regarding

  • Q : Enter or leave the market by resources

    For a purely competitive industry in the long run: (i) several firms exit hence others may earn more than normal profits. (ii) established firms reap higher profits than newer firms. (iii) all resources are fixed for the industry as an entire. (iv) pe

  • Q : Competition-Social Welfare problem The

    The purely competitive firm in the output market which hires from a purely competitive labor market will employ the labor at the point where VMP = W as the firm: (i) Operates in society's best interest. (ii) Wants to be quite fair to workers. (iii) Is egalitarian inst

  • Q : Marginal Benefits The marginal

    The marginal advantage/profit to you of a usual activity in which you engage tends to: (i) Raise as long as you enjoy the activity. (ii) Eventually reduce as you do more of activity. (iii) Stabilize when the market price of doing the activity stay constant. (iv) Impro

  • Q : Slopes of demand and supply curves The

    The slopes of demand and supply curves are frequently: (w) misleading as guides to price elasticities. (x) independent of the units measuring changes in price and quantity. (y) highly dependent upon each other. (z) used to forecast changing consumer t

  • Q : Define marginal cost Marginal cost : It

    Marginal cost: It is the change in sum cost by generating one more or less unit of output.

  • Q : Maximum possible economic profit of firm

    This firm’s maximum possible economic profit equals: (i) $12,000 per period. (ii) $16,000 per period. (iii) $20,000 per period. (iv) $24,000 per period. (v) $28,000 per period.

    Q : Isoquants and isocost lines By using

    By using isoquants and isocost lines, illustrates graphically that rise in y will result in a decline in the quantity demanded of x1 and also illustrates that rise in the price of x1 will result in a reduction in the quantity demanded of x1<