--%>

Depict the slope of the line

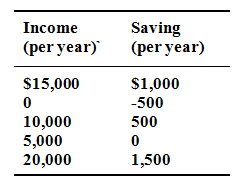
The given table contains data on the relationship among saving and income.  Rearrange these data in a meaningful order and graph them onto the accompanying grid. Depict the slope of the line?  And vertical intercept? Interpret the meaning of the slope and the intercept both. Write down the equation that represents this line. What would you calculate saving to be at the $12,500 level of income?

421_slope of the line.png

E

Expert

Verified

Income column:  $0; $5,000; $10,000, $15,000; $20,000. Saving column: $-500; 0; $500; $1,000; $1,500.  Slope = 0.1 (= $1,000 - $500)/($15,000 - $10,000). Vertical intercept = $-500. The slope illustrates the amount saving will rise for every $1 rise in income; the intercept illustrates the amount of saving occurring whereas income is zero. Equation: S = $-500 + 0.1Y (where S is saving and Y is income). Saving is $750 at the $12,500 income level.

   Related Questions in Finance Basics