Demonstrates the Lorenz Curve
This given figure demonstrates as: (w) Lorenz curve. (x) familial income distribution graph. (y) Gini curve. (z) Blanc income standard curve. How can I solve my Economics problem? Please suggest me the correct answer.
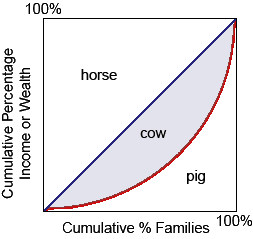
This given figure demonstrates as: (w) Lorenz curve. (x) familial income distribution graph. (y) Gini curve. (z) Blanc income standard curve.
How can I solve my Economics problem? Please suggest me the correct answer.
I have a problem in economics on Efficiency Wages problem. Please help me in the following question. The Efficiency wages: (i) do not maximize firm profit. (ii) Cause involuntary unemployment. (iii) Are paid due to adverse selection. (iv) Are never se
The three reasons for downward slope of a demand curve are: (1) Diminishing marginal utility, income effect and the substitution effect. (2) Scarcity, tastes & preferences, and purchasing power. (3) Opportunity costs, rational decision making and
When the annual interest rate is 11 percent and a small office building can be expected to lease perpetually for price of $33,000 annually, the building and also the land it sits onto have a present value of approximately: (1) $363,00
In output markets, the simple circular flow model, households replace their _________ for _________.Can someone help me in determining the right answer from the given options. (1) Resources | income. (2) Labor | goods. (3) Income | goods. (4) Go
I have a problem in economics on Short run for production. Please help me in the following question. In short run for production: (1) Both variable and fixed costs exist. (2) Productive capacity might be adjusted. (3) Unprofitable firms shut down. (4) No fresh workers
I have a problem in economics on Problems regarding Attributes of Goods. Please help me in the following question. The intrinsic characteristics which make or detract from the satisfaction derived from consuming a good are termed as: (1) Attributes. (2) Factors. (3) U
Provide solution of this question. Supposing no other changes, if balances in small time deposits increase by $30 billion and money market mutual funds held by businesses decrease by $30 billion, the: A) M1 and M2 money supplies will not change. B) M2 and MZM money su
A monopolist who does not price discriminate, that is: (w) cannot maximize profit by producing where demand is unitarily elastic. (x) will maximize profit where demand is unitarily elastic when all costs are fixed. (y) will maximize profit where deman
I have a problem in economics on Maximization of the Goals of Firm. Please help me in the following question. The firm’s goal of profit maximization is most distantly analogous to: (i) Revenue maximization by the Internal Revenue Agents. (ii) Ma
Jana chugs 5 big cups of Gatorade in five minutes after winning the marathon. Jana’s marginal utility is much likely to be: (1) Equivalent for each cup as she was very thirsty. (2) Maximized at 3 cups, when she is reaching the equilibrium. (3) Diminishing whenev
18,76,764
1957573 Asked
3,689
Active Tutors
1426407
Questions Answered
Start Excelling in your courses, Ask an Expert and get answers for your homework and assignments!!