--%>

Demand for product is most elastic at price

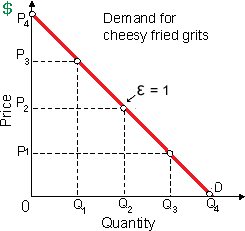
From these points in this figure, demand for cheesy fried grits is largely elastic at a price of: (w) P1 and quantity of Q3. (x) P2 and quantity of Q2. (y) P3 and quantity of Q1. (z) P4 and quantity of 0.

1937_Price Elasticity of Demand5.png

Can someone explain/help me with best solution about problem of Economics...

   Related Questions in Microeconomics

  • Q : Rises price elasticity of demand for a

    The price elasticity of demand for a good will tend to rise as the: (i) number of obtainable substitutes increases. (ii) consumer income level increases. (iii) good is a less significant budget item. (iv) time permitted for response decreases. (v) ela

  • Q : Marginal social benefits of products If

    If an oligopoly achieves equilibrium, in that case the marginal social: (w) benefits of their products exceed the marginal social costs. (x) cost of their product exceeds the marginal social benefit. (y) benefits equal the marginal so

  • Q : Demand curve for peanuts Question: a)

    Question: a) Johnny consumes peanuts (x1) and a composite good (x2). His utility function is U = x1x2. His marginal utilities are MU1 = x<

  • Q : Problem on Complementary Goods From the

    From the viewpoints of auto makers, the weakening of OPEC oil cartel in the year 1990s resulted in a/an: (1) Rise in demand for cars. (2) Reduction in demand for cars. (3) Rise in the supply of cars. (4) Reduction in supply of cars.

    Q : Firms in purely competitive markets

    Firms within purely competitive markets as: (1) practice price discrimination more often than do firms along with market power. (2) do not price discriminate since they are more interested in their customers than are monopolists. (3) cannot price disc

  • Q : Price ceilings and price floors Price

    Price ceilings and price floors: 1) cause surpluses and shortages respectively. 2) make the rationing function of free markets more efficient. 3) interfere with the rationing function of prices. 4) shift demand and supply curves and therefore have no effect on the rat

  • Q : Inequality in the distribution of income

    Increased inequality within the distribution of income into the United States since around 1975 is least attributable to: (1) baby boomers becoming adults. (2) a shift from manufacturing to service industries. (3) the rising percentage of households h

  • Q : Annual total costs of production When

    When Prohibition Corporation maximizes profit into its production of St. Valentine’s Day software, there annual total costs of it will be around: (1) $180 million. (2) $140 million. (3) $100 million. (4) $80 million. (5) $40 mil

  • Q : Goods and services Refer to the above

    Refer to the above data. Choose the right answer from following. Zabella's balance on goods and services illustrates a: A) $5 billion deficit. B) $5 billion surplus. C) $10 billion surplus. D) $15 billion deficit.

    Q : Price cross-elasticities of demand When

    When the price of thermal underwear is increased from $12 to $18 per pair, because of the quantity of cross country snow skis to decline by 1,200 to 800 pairs annual, such goods are ____ and the price cross elasticity of demand equiva