Demand for a good at price elasticity one
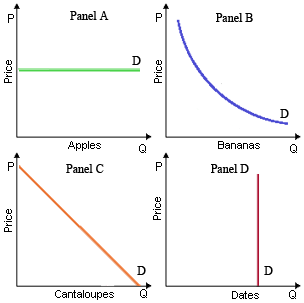
The curve which could demonstrate the demand for a good which has price elasticity equal to one is within: (w) Panel A. (x) Panel B. (y) Panel C. (z) Panel D. Please choose the right answer from above...I want your suggestion for the same.
The curve which could demonstrate the demand for a good which has price elasticity equal to one is within: (w) Panel A. (x) Panel B. (y) Panel C. (z) Panel D.
Please choose the right answer from above...I want your suggestion for the same.
Average variable costs per generic brick of this pure competitor equal approximately: (i) $.02 (2 cents per brick). (ii) $.04 (4 cents per brick). (iii) $.07 (7 cents per brick). (iv) $.09 (9 cents per brick).
Assume a drought in the Great Plains reduces the supply of wheat. Noting that wheat is a basic ingredient in the production of bread and that potatoes are a consumer substitute for bread, we would expect the price of wheat to: A) rise, the supply of bread to increase,
The value of land is attributable to the ways exactly sites decrease transportation and other transaction costs are termed as: (1) location rents. (2) transportation rents. (3) short term quasi rents. (4) parcel posts. (5) transaction
The demand curve which is least consistent along with the existence of a substitution consequence is within: (w) Panel A. (x) Panel B. (y) Panel C. (z) Panel D. Q : Examples of Labor The contracts needing employment after some worker’s jobs have been made obsolete through automation are illustrations of: (i) Blacklisting. (ii) Labor-reducing protectionism. (iii) Check-off provisions. (iv) Yellow dog contracts. (v) Feather-bedding.
The contracts needing employment after some worker’s jobs have been made obsolete through automation are illustrations of: (i) Blacklisting. (ii) Labor-reducing protectionism. (iii) Check-off provisions. (iv) Yellow dog contracts. (v) Feather-bedding.
When the price elasticity of demand for Japanese cars is higher within Europe than into the U.S. and transportation costs are very similar, relative to the price charged in Europe, there the price a discriminating Japanese carmaker wo
What are the types of market economies?
I am facing difficulty in this question .Provide me correct answer of this question to complete my assignment. Why? Neoclassical production theory contains marginal products and heterodox production theory does not.
Into equilibrium, a monopoly which does NOT price discriminate will tend to produce: (w) the socially optimal rate of output. (x) a level of output where price exceeds marginal social cost. (y) lower output at lower prices than a competitive market. (
Marginal physical product: It refers to the addition build to the total product.
18,76,764
1940416 Asked
3,689
Active Tutors
1425771
Questions Answered
Start Excelling in your courses, Ask an Expert and get answers for your homework and assignments!!