--%>

Demand and supply conditions in the competitive market

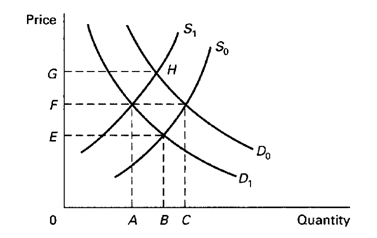
Refer to the following diagram, which depictes demand and supply conditions in the competitive market for product X. A shift in the demand curve from D0 to D1 might be caused by a(n): 1) decrease in income if X is an inferior good. 2) increase in the price of complementary good Y. 3) increase in money incomes if X is a normal good. 4) increase in the price of substitute product Y.


1679_97.png

Help me to get through this problem

   Related Questions in Microeconomics

  • Q : Comparison between supply curves

    Comparing supply curves S2 and S3, supply is: (w) more price elastic along S2 than along S3. (x) more price elastic along S3 than S2. (y) equally elastic along both when they have simil

  • Q : Determine equilibrium price and quantity

    Suppose a growth hormone is introduced that allows dairy farmers to offer 125 million more litres of milk per year at each price. a. Construct new demand and supply curves reflecting this change. Describe with words what happe

  • Q : Economists statement for sales to a

    When Serena Williams, Cindy Crawford, Hillary Clinton, Katy Couric, Jennifer Lopez, and Ashanti all start wearing Wal-Mart jeans at public appearances, economists would explain any resultant raise in Wal-Mart’s jean sales to the change in: (1) Expectations regar

  • Q : Microeconomics Assignment Please give

    Please give me a quote for this uploaded assignment. I need it by the 10th of may 2013. Thank You

  • Q : Specific market price The difference

    The difference among maximum amount which consumers would willingly pay for a particular quantity of a good and the amount they really pay at a specific market price is termed as: (i) Discount rate. (ii) Mark-up factor. (iii) Familial gains. (iv) Hous

  • Q : Problem regarding to trade restrictions

    When the U.S. imposes quotas which restrict imports of textiles from China, this decrease the: (w) demand for textiles within the U.S. (x) supply of Chinese textiles to Europeans. (y) supply of textiles in the U.S. (z) incomes of U.S. textile makers.

    Q : Demand for a good at price elasticity

    The curve which could demonstrate the demand for a good which has price elasticity equal to one is within: (w) Panel A. (x) Panel B. (y) Panel C. (z) Panel D.

    Q : Quantity demanded and goods price The

    The law of demand defines that there is a negative relationship among: (1) A good’s price and quantity demanded. (2) Limitless demands and inadequate resources. (3) The quantities demanded and supplied. (4) People’s income and demands for

  • Q : Competition in output and resource

    The purely competitive model means that competition in both output and resource markets yields a distribution of income that is proportional to the: (w) numbers of people in specific households. (x) effort and leisure sacrificed throu

  • Q : Follow Lower Bond Price Lower bond

    Lower bond prices follow through higher: (w) interest rates. (x) real estate speculation. (y) present value of future income by the bonds. (z) growth rates of national income. Please choose the right answer from ab