The supply curve which would best reflect the supply of 1940 a Packard 180 limousine is as: (i) supply curve S1. (ii) supply curve S2. (iii) supply curve S3. (iv) supply curve S4. (v) supply curve S5.
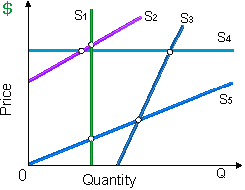
Hey friends please give your opinion for the problem of Economics that is given above.