--%>

Consumption of goods changes as income changes

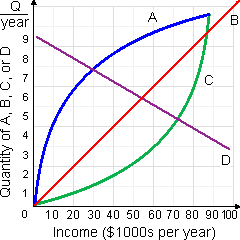
This below figure demonstrates how consumption of goods A, B, C and D changes as a family’s income changes. When income increases, the income elasticity of demand is positive although declining for: (w) good A. (x) good B  (y) good C. (z) good D.

2057_Income Elasticity of Demand.png

How can I solve my economics problem? Please suggest me the correct answer.

   Related Questions in Microeconomics

  • Q : Barriers to entry in the long run

    Imperfectly competitive firms protected by important barriers to entry are as: (1) assured of positive accounting profits in the short run. (2) almost certain to succeed in collusively fixing prices at high levels. (3) assured of positive economic pro

  • Q : Change in relative price I have a

    I have a problem in economics on Change in relative price. Please help me in the following question. The Substitution takes place all along a demand curve when there is a: (1) Rapid shortage of a required product. (2) Increase in the common price level. (3) Change in

  • Q : Please In the quintile distribution of

    In the quintile distribution of income, the term "quintile" represents: A 5 percent of the income receivers. B 10 percent of the income receivers. C 15 percent of the income receivers. D 20 percent of the income receivers.

  • Q : Income Distribution in Lorenz Curve

    When line 0D0' represents the 1929s U.S. income distribution and line 0B0'shows the 1975 income distribution, in that case the 2005 year’s income distribution would be signified by: (i) line 0A0'. (ii) line 0B0'. (iii) line 0C0'. (iv) line 0D0'.

  • Q : Price elasticity of supply problem The

    The price elasticity of supply generally evaluates the ratio of relative: (i) Gain to the amounts firms supply at different prices. (ii) Price increase need to induce a firm to raise output. (iii) Change in the quantity supplied to a associative chang

  • Q : Illustrations of homogeneous goods

    Illustrations of homogeneous goods would comprise: (i) automobile tires. (ii) athletic shoes. (iii) personal computers. (iv) most farm products. (v) college textbooks. Hey friends please give your opinion for the p

  • Q : Total variable costs in pure competition

    This profit-maximizing, as in demonstrated graph, of brickyard’s total variable costs are about: (i) $200 per day. (ii) $600 per day. (iii) $750 per day. (iv) $900 per day. (v) $1200 per day.

  • Q : Purpose of HMOs and PPOs Give the

    Give the answer of following question. The main purpose of HMOs and PPOs is to: A) reduce health care costs for employers and their employees. B) reduce medical malpractice suits. C) enable groups of physicians to increase their fees. D) direct patients to specialists

  • Q : Estimating N.I. by product by value

    Describe the steps taken in estimating N.I. by product/ value added technique? Answer: A) Classify all production units: Locate

  • Q : Precise Equality of Income Distribution

    Precise equality of income distribution is demonstrated by: (1) line 0A0'. (2) line 0B0'. (3) line 0C0'. (4) line 0D0'. (5) line 0E0'.

    Discover Q & A

    Leading Solution Library
    Avail More Than 1450288 Solved problems, classrooms assignments, textbook's solutions, for quick Downloads
    No hassle, Instant Access
    Start Discovering

    18,76,764

    1928138
    Asked

    3,689

    Active Tutors

    1450288

    Questions
    Answered

    Start Excelling in your courses, Ask an Expert and get answers for your homework and assignments!!

    Submit Assignment

    ©TutorsGlobe All rights reserved 2022-2023.