--%>

Compute the stoke statistics

Please do the following and submit your results in the table format in a word file on canvas:

a)      Go to Yahoo finance/Investing/Stocks/Research tools/Historical quotes/Historical prices and download adjusted monthly closing prices for the period 1/1/2006 to 31/12/2012 for:

Exxon (XOM)

Walmart (WMT)

S&P 500 (^GSPC)

b)      Sort data from oldest to newest record.

Compute monthly returns for each stock and index:

Return at time t = (Pt-Pt-1)/Pt-1

c)      Compute the following statistics for each stock and the index:

        i.            Average monthly return

        ii.            Geometric monthly return and the corresponding annual return.

        iii.            The monthly standard deviation and corresponding annual standard deviation

        iv.            Use the monthly returns and compute the correlation between each pair (Exxon-Walmart, Exxon-S&P 500, Walmart-S&P 500).

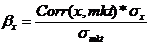
        v.            What is the beta for each stock? The beta for stock x is given by the following formula,

2374_Untitled 12.png

Please present your results in the following format:

Statistic

Exxon

Walmart

S&P 500 Index (mkt)

Average monthly return


Compounded monthly return


Annual return


Monthly standard deviation


Annual standard deviation


Correlation


Exxon-Walmart =


Exxon-S&P 500 =


Walmart-S&P 500 =


Beta


   Related Questions in Basic Statistics

  • Q : What is Inter-arrival times

    Inter-arrival times:A) Requests arrive randomly, often separated by small time intervals with few long separations among themB) The time until the next arrival is independent of when the last arrival occurredC) Coro

  • Q : Time series what are the four

    what are the four components of time series?

  • Q : Report on Simple Random Sampling with

    One of my friend has a problem on simple random sampling. Can someone provide a complete Report on Simple Random Sampling with or without replacement?

  • Q : Problem on Model Checking Part (a).

    Part (a). Draw a state diagram for a car with the following state variables: D indicating whether the car is in drive; B indicating the brake pedal is depressed; G indicating the gas pedal is depressed; and M indicating whether the car is moving. (For example, the sta

  • Q : Sample z test and Sample t test A

    A random sample X1, X2, …, Xn is from a normal population with mean µ and variance σ2. If σ is unknown, give a 95% confidence interval of the population mean, and interpret it. Discuss the major diff

  • Q : Define Operational Analysis

    Operational Analysis: • Analysis method based on the measurement of the operational characteristics of the system.

    Q : STATISTICS Question This week you will

    This week you will analyze if women drink more sodas than men.  For the purposes of this Question, assume that in the past there has been no difference.  However, you have seen lots of women drinking sodas the past few months.  You will perform a hypothesis test to determine if women now drink more

  • Q : Develop the most appropriate regression

    Predicting Courier Costs The law firm of Adams, Babcock, and Connors is located in the Dallas-Fort metroplex.  Randall Adams is the senior and founding partner of the firm.  John Babcock has been a partne

  • Q : Computers playing games How Computers

    How Computers playing games can be categorized according to different dimensions?

  • Q : Principles of data analysis For the

    For the data analysis project, you will address some questions that interest you with the statistical methodology we are learning in class. You choose the questions; you decide how to collect data; you do the analyses. The questions can address almost any topic,