--%>

Compute Gini Index

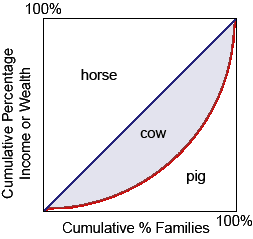
The areas illustrates in this Lorenz diagram can be used to compute a Gini index as: (i) (cow + pig)/cow. (ii) cow2/(cow + pig).  (iii) pig2/(cow + pig). (iv) cow/(cow + pig) (v) (cow + horse)/pig.

997_Lorenz Curve Problem.png

Can anybody suggest me the proper explanation for given problem regarding Economics generally?

   Related Questions in Microeconomics

  • Q : Transaction costs by pure economic rents

    When transaction costs exist, in that case taxes on what appear to be pure economic rents to: (1) pose especially severe problems for economic efficiency. (2) may be inefficient since taxes reduce incentives to put resources to their

  • Q : Problem on Equilibrium price What

    What happens to equilibrium price if increase in demand is equivalent to increase in supply? Answer: In case of equivalent increase in demand and supply the equilib

  • Q : Market supply and demand information

    Elucidate what kind of market supply and demand information would be use full to you in deciding on a business policy?

  • Q : Socially optimal output in perfectly

    Assume that no externalities in production or consumption exist and the income distribution is universally viewed such as “fair.” When this firm could price discriminate perfectly, one condition for socially optimal output would be for: (i

  • Q : Budget for in-kind transfer payment

    Current budgets for transfers “in-kind” have developed most significantly for spending upon: (w) Medicare and Medicaid. (x) food stamps. (y) public housing. (z) grants to expand educational opportunity.

  • Q : Incentives given by higher interest rate

    Higher interest rates give incentives for: (w) a corporation to build a new plant. (x) a family to save more. (y) a family to buy a new house. (z) automakers to produce more new cars. Please choose the right answer

  • Q : Increasing in real market rate of

    The real market rate of interest will increase when there is an increase into: (w) pessimism on the parts of investors. (x) willingness to hold illiquid assets. (y) total capital stock relative to national output. (z) households’ desires to cons

  • Q : Area of Loren Curve This function as in

    This function as in illustrated figure area between A and B is termed as a/an: (1) index of inequality. (2) Lorenz curve. (3) Pareto indicator. (4) Gini coefficient. (5) Marx-Engels curve.

    Q : Movement of Supply Curve towards up and

    The rise in the price of Pepsi will effect a: (1) Shift of the supply curve of Coke to left. (2) Shift of the supply curve of Pepsi to right. (3) Movement downwards all along the supply curve of Coke. (4) Movement up and to right all along the supply curve of Pepsi.

  • Q : Aggregate Supplies of Labor The

    The Supplies of labor from a specified population mainly depend on the: (1) Structure of wage rates. (2) Labor force participation rates of different population sub-groups. (3) Individual preferences for the work and income versus the leisure. (4) Levels of investment