--%>

Comparison between supply curves

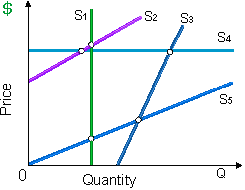
Comparing supply curves S2 and S3, supply is: (w) more price elastic along S2 than along S3. (x) more price elastic along S3 than S2. (y) equally elastic along both when they have similar slope. (z) unitarily elastic beside S3, and perfectly elastic along S2.

1385_Price Elasticity of Supply1.png

Hello guys I want your advice. Please recommend some views for above Economics problems.

   Related Questions in Microeconomics

  • Q : Analytic Time-The Long Run Can someone

    Can someone please help me in finding out the accurate answer from the following question. Alfred Marshall classification of analytical time specified that in long run it is: (i) Not possible to differ technology and at least one resource is fixed and hence at least o

  • Q : Profit Maximization in Labor Markets

    Can someone help me in finding out the right answer from the given options. All the profit maximizing organizations employ labor up to the point where: (1) MR   MC is maximized. (2) VMP = MFC. (3) VMP = MRP. (4) MRP = MFC. (5) VMP = w.

  • Q : Arising Economic Discrimination

    Economic discrimination occurs while: (1) economic rents are received by resource suppliers. (2) wages are proportional to workers’ differing productive contributions. (3) household incomes differ because of different resource ownership. (4) pur

  • Q : Backward Bending Labor Supplies Graph

    Graph for the supply of labor might be backward bending since: (i) The substitution effect overtakes the income effect at some wages. (ii) Overtime workers get pay for time and a half. (iii) The substitution effect. (iv) The income effect is much powerful than substit

  • Q : Elimination of exploitation The removal

    The removal of exploitation of labor [that is, wage payments beneath the value to society of each and every individual worker’s productive contribution] is automatic when business decision makers: (1) Should set wages via collective bargaining agreements with th

  • Q : Percentage of incomes persistently The

    The percentage of American families along with incomes persistently below the poverty line is around: (w) 1 2%. (x) 3 5%. (y) 5 7%. (z) 8 10%. Can anybody suggest me the proper explanation for given problem regardi

  • Q : Centers for production in circular flow

    I have a problem in economics on Centers for production in circular flow model. Please help me in the following question. The centers for production in a circular flow model are termed as: (1) Households. (2) Public enterprises. (3) Business firms. (4

  • Q : Numerical question regarding demand At

    At $1.50 per gallon, Alana purchases 50 gallons of gasoline weekly, Bart purchases 20 gallons weekly, and Caitlin purchases 20 gallons weekly. One point on their joint demand curve for gasoline would be Q =: (1) 90 gallons per week, P = $1.50. (2) 90 gallons per week,

  • Q : Rent controls fix rent in equilibrium

    Rent controls which fix rents below equilibrium will NOT: (w) maintain monetary rents down. (x) create shortages of rental housing. (y) stimulate non-market allocations of rental housing. (z) maintain the opportunity costs of housing down.

  • Q : Testing Functional structure models

    Testing Functional structure models: It is often hard to tell whether the functional model structure chosen (which almost always in published work appears to generate consistent and robust results) is the only one tested or not.

    Discover Q & A

    Leading Solution Library
    Avail More Than 1422366 Solved problems, classrooms assignments, textbook's solutions, for quick Downloads
    No hassle, Instant Access
    Start Discovering

    18,76,764

    1943793
    Asked

    3,689

    Active Tutors

    1422366

    Questions
    Answered

    Start Excelling in your courses, Ask an Expert and get answers for your homework and assignments!!

    Submit Assignment

    ©TutorsGlobe All rights reserved 2022-2023.