--%>

Changing in marginal cost without price and output

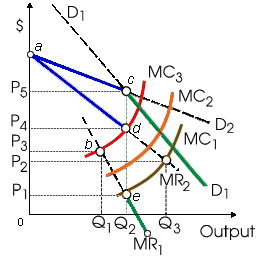
When this firm's marginal cost curve moved upward from MC2 to MC3, the firm would: (w) reduce output from Q3 to Q2 and increase price from P3 to P4. (x) reduce output by Q2 to Q1 and raise price from P4 to P5. (y) not change its price or output. (z) shut down.

1969_Kinked Demand Curve.png

Can anybody suggest me the proper explanation for given problem regarding Economics generally?

   Related Questions in Microeconomics

  • Q : Investment in Equilibrium Investment is

    Investment is within equilibrium in all of the given cases EXCEPT while: (w) after adjusting for risk, maturity, and liquidity, all income producing assets yield identical returns. (x) all prices of assets exactly equal their respecti

  • Q : Integrity and humanitarianism in

    The economic system which depends associatively the least for its effectiveness and overall success on honesty and of members of economically and socially most elite groups in the system are nearly certainly: (1) Oligarchintegrity and hum

  • Q : Question on demand and supply Refer to

    Refer to the following diagram. A decrease in supply is illustrated by a: A) move from point x to point y. B) shift from S1 to S2. C) shift from S2 to S1. D) move from point y to point x.

    Q : Compute price elasticity At price of

    At price of Rs. 20 the unit quantity demanded is 300 units. Its price downs by 10% its quantity demanded rises by 60 units. Compute price elasticity. Answer: <

  • Q : Pure competition for quantity adjustment

    The only industrial structure in that all firms are pure quantity-adjusting price takers is: (1) impure oligopoly. (2) pure monopoly. (3) pure or perfect competition. (4) monopolistic competition. (5) pure oligopoly.

    Q : Imposition of rent controls under

    The imposition of rent controls below equilibrium rental rates tends to create: (i) a housing surplus. (ii) booms of new apartment construction. (iii) declines in the quantity and upkeep of rental units. (iv) rising incomes for landlords. (v) enhanced

  • Q : Reading Production Possibilities

    I have a problem in economics on reading the Production Possibilities Frontiers graph. Please help me in determining the right answer from the following question. The graph below depicts the mythical country of the Sandwichia’s:

    Q : Determine average production cost by an

    When Robomatic Corporation maximizes profit in its production of RoboMaids, its average production cost per robot will be roughly: (1) $3,000 per robot. (2) $5,000 per robot. (3) $7,000 per robot. (4) $9,000 per robot. (5) $11,000 per robot.

  • Q : Profit-maximizing price The

    The profit-maximizing price for “Silver Screen Classic” of Nostalgia DVDs is: (i) $6 per copy. (ii) $10 per copy. (iii) $12 per copy. (iv) $16 per copy. (v) $20 per copy.

    Q : Price elasticity of demand I have a

    I have a problem related to price elasticity of demand. The question is illustrated as "After the price of movie tickets rose, I spent less money on movie tickets." What can you infer regarding my price elasticity of demand?