Changes in total revenue by price falls
When the price falls along such demand curve for pizza, in that case total revenue: (w) falls. (x) rises, then falls. (y) rises. (z) does not change. Can anybody suggest me the proper explanation for given problem regarding Economics generally?
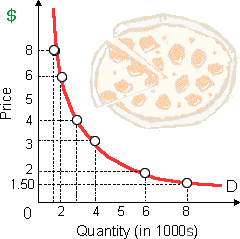
When the price falls along such demand curve for pizza, in that case total revenue: (w) falls. (x) rises, then falls. (y) rises. (z) does not change.
Can anybody suggest me the proper explanation for given problem regarding Economics generally?
Choose Which one best describes the invisible-hand concept? 1) The desires of resource suppliers and producers to further their own self-interest will automatically further the public interest. 2) The nonsubstitutability of resources creates a conflict between private
The legality of trade unions as the labor monopolies and illegality of the monopolies in product markets is most rationally described by the: (i) Trade union’s interest in the social welfare and firm’s interest only in gains. (ii) Number of people who adva
When firms or individuals attempt to personal gains or maximize profits or to minimize losses by trying to predict how other firms or individuals are probable to reaction, decisionmaking involves: (i) parallelism of action. (ii) profit maximization. (
One of my friend has a problem on substitution effect. The original equilibrium point (that is utility-maximizing bundle) in the graph shown below is at point A. The price of good Y is increased, pivoting the budget constraint down to its latest level.a. F
If $4 is Firm B's profit-maximizing price, its: A) ATC must be $4. B) MC must be $4. C) MR must be $4. D) MC must be zero. Help me to get
The shift of the budget line from cd to ab in the below given figure is consistent with: 1) decreases in the prices of both M and N . 2) an increase in the price of M and a decrease in the price of N . 3) a decrease in money income. 4) an increase in money inc
Refer to the following diagram, which depictes demand and supply conditions in the competitive market for product X. A shift in the demand curve from D0 to D1 might be caused by a(n): 1) decrease in income if X is an inferior good. 2) increase in the price of compleme
The ratio of the area among the diagonal line of perfect equality and the Lorenz curve to the total area in the diagonal is the: (1) poverty index. (2) human capital coefficient. (3) needs coefficient. (4) negative-tax index. (5) Gini index.
“Law of Distribution” given by Vilfredo Pareto asserts that the: (w) relative prices for goods reflect how intensively labor is used as an input. (x) the percentages of national income going to labor and to capital is a co
I have a problem in economics on what is the sum of market demand for a good. Please help me in the following question. The other things constant, market demand for the good is a sum of: (i) Firm’s utility-maximizing decisions. (ii) Amounts dema
18,76,764
1929920 Asked
3,689
Active Tutors
1433142
Questions Answered
Start Excelling in your courses, Ask an Expert and get answers for your homework and assignments!!