--%>

CAPM and Portfolio

The information is illustrated below:

792_Ami.jpg

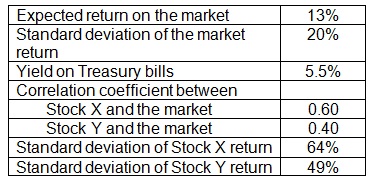
(a) Determine the expected return on Stock X?

(b) Evaluate the expected return on Stock Y?

(c) Assume that you have $5,000 to invest in a portfolio made up of Stocks X and Y. How will you allot your funds between Stock X and Stock Y in order to attain a portfolio return of 15.67 percent?

(d) Compute the beta of the portfolio in part (c). How risky is this portfolio? Describe.

(e) Your friend recommends that you purchase Stock Z which has a beta of 2.76 and has an expected return of 21.75 percent. Would you purchase Stock Z? Describe.

   Related Questions in Microeconomics

  • Q : Implication of price discrimination

    Price discrimination implies: (1) charging different prices for identical goods that have identical production costs. (2) paying wages based on race or sex quite than productivity. (3) exploiting the working masses by charging the highest single price

  • Q : Highest income in supply Glynn s weekly

    Glynn s weekly income would be the highest at: (1) point a. (2) point b. (3) point c. (3) point d. (4) point e. 1621_Labor-Leisure Trade-off</span></p>
                                        </div>
                                        <!-- /comment-box -->
                                    </li>
   
   </td>
	</tr><tr>
		<td>
       
      <li>
                                        <div class=

    Q : Question on demand and supply Refer to

    Refer to the following diagram. A decrease in supply is illustrated by a: A) move from point x to point y. B) shift from S1 to S2. C) shift from S2 to S1. D) move from point y to point x.

    Q : Demand when price of good or resource

    When the price of a good or resource drops, the demands for: (i) That good or resource raise. (ii) Complementary goods or resources reduce. (iii) Substitute goods or resources reduce. (iv) Luxury goods and inferior resources drop.

  • Q : Median Relative Income Measurement A

    A family which has income greater than half the median incomes of other American families, although less than twice which median income, is categorized by the Department of the Census as: (1) impoverished. (2) low relative income. (3) working class. (

  • Q : Match price cuts but avoid price hikes

    A firm’s perception which competitors will match price cuts but avoid price hikes yields: (w) price leadership behavior. (x) limit pricing structures. (y) kinked demand curves. (z) monopolistic competition. Can anybody sugges

  • Q : Determine produce economic profit When

    When point e corresponds to $9,000 per RoboMaid, Robomatic can produce economic profit all month of at most around: (1) $25 million. (2) $40 million. (3) $55 million. (4) $70 million. (5) $85 million.

    Q : Income elasticity and population growth

    For most families inside the United States, there the income elasticity of demand appears to be lowest, upon average, while looking the demand for: (1) better government. (2) environmental quality. (3) education. (4) children. (5) vac

  • Q : Analytic time and profit maximization

    Firm A in below illustration of figure maximizes profit and is: (1) demonstrated as operating in the long run. (2) capable of reaping economic profit of P2P1de, since only in the short run. (3) incurring economic losses equivalent to fixed costs of P3

  • Q : Market shifting in equilibrium When

    When market begins in equilibrium at point e upon S0D0 and in that case young American families increasingly "inherit" furniture like their baby-boomer parents move within smaller retirement homes, that market will tend to shift in the direction