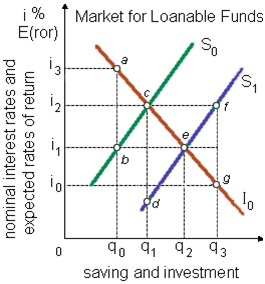
This capital market is within this illustrated figure a closed private economy. The first plans of savers and investors are demonstrated as curves S0 and I0. There market equilibrium will exist at: (1) point a. (2) point b. (3) point c. (4) point d. (5) point e.
Can anybody suggest me the proper explanation for given problem regarding Economics generally?