--%>

Break-even level of income under negative income tax

For a family of four the break-even level of income under the negative income tax system demonstrated in this figure is: (1) $15,000 per year. (2) $30,000 per year. (3) $45,000 per year. (4) $60,000 per year. (5) $75,000 per year.

230_Negative Income Tax Problem.png

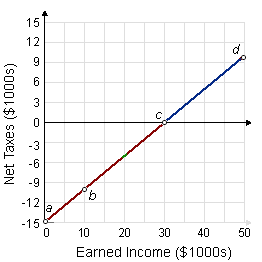
Hey friends please give your opinion for the problem of Economics that is given above.

   Related Questions in Microeconomics

  • Q : Demand and Supply-Production to double

    When Mary usually quaffs three glasses of Lost Horizons Cabernet Sauvignon every day, her demand for her favorite vintage will be least probable affected by: (i) The plague of grape worms ruining the bouquet of Lost Horizons Cabernet (ii) Receiving a $2 an hour pay hi

  • Q : Nominal wages If the nominal wages of

    If the nominal wages of carpenters rose by 5 percent in the year of 2000 and the price level increased by 3 percent, then the real wages of carpenters: A) decreased by 2 percent. B) increased by 2 percent. C) increased by 3 percent. D) increased by 8 percent.

  • Q : What is Imperfect data Imperfect data :

    Imperfect data: Most studies start with imperfect data. Few datasets involve the entire population of interest. Typically, the data has been gathered by others for specific purposes, and as such may have built in b

  • Q : Define Oligopoly and its characteristics

    Explain the term Oligopoly? Also explain its Characteristics?

  • Q : Prices of resources in constant cost

    When industry expansion or contraction does not influence the prices of resources used through its firms, then the industry tends to experience: (w) increasing costs. (x) constant costs. (y) decreasing costs. (z) diseconomies of scale.

    Q : Socially optimal output in perfectly

    Assume that no externalities in production or consumption exist and the income distribution is universally viewed such as “fair.” When this firm could price discriminate perfectly, one condition for socially optimal output would be for: (i

  • Q : Graphical relationship depicted by

    Demand curves graphically depict the relationships which are: (i) Positive among the demand for a good and its relative price. (ii) Negative between the quantity demanded and the opportunity cost of a good. (iii) Positive between income and expenditures. (iv) A horizo

  • Q : Average of incurring total fixed costs

    This brickyard is incurring total fixed costs which average about: (1) $200 daily. (2) $300 daily. (3) $400 daily. (4) $500 daily (5) $600 daily.

    Q : Price of a share of corporate stock

    When the price of a share of corporate stock increases, all else identical, there will be reduces in the: (w) overall liquidity of a portfolio which includes the stock.  (x) likelihood that the individual who owns the stock will sell this. (y) ra

  • Q : Competitive Markets and Labor unions I

    I have a problem in economics on Competitive Markets-Labor unions. Please help me in the following question. The purely competitive labor markets are not characterized through: (1) Most of the individual buyers and sellers of the labor services. (2) S