--%>

Average variable costs and average total costs

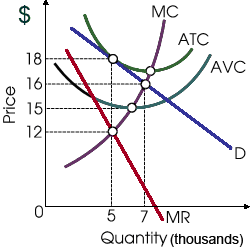
Both average variable costs and average total costs are demonstrated for this profit-maximizing firm, therefore this given figure depicts information for: (i) an oligopoly firm. (ii) operations in the short run since fixed costs are present, although we can also infer which this firm is in long run equilibrium since this is generating zero economic profits. (iii) a monopolistic competitor. (iv) a pure competitor in the output market along with some market power while buying resources. (v) a pure monopoly.

1648_Monopolistic Competition1.png

How can I solve my Economics problem? Please suggest me the correct answer.

   Related Questions in Microeconomics

  • Q : Least consistency for law of demand The

    The demand curve for socket sets from the list below which is least consistent along with the law of demand is: (w) demand curve D1D1. (x) demand curve D2D2.  (y) demand curve D3D3

  • Q : Spending pattern for maximizing utility

    The consumer maximizes utility if spending patterns cause: (1) Level of net utility to increase each time purchases are modified. (2) Marginal utilities of each and every good consumed to be equivalent. (3) Principle of corresponding marginal utilities per dollar to b

  • Q : Illustrations of Predatory Behavior

    Tactics as like [a] lowering prices, [b] expanding output beyond a short run profit maximizing level, and [c] aggressively advertising or redesigning existing products to make them incompatible along with rivals’ products are most likely to be interpreted as ill

  • Q : Minimize losses of purely competitive

    The wholesale price per dozen roses below that such purely competitive rose farm would minimize losses through closing their operation is: (1) $3.00 per dozen roses. (2) $3.83 per dozen roses. (3) $4.00 per dozen roses. (4) $4.30 per

  • Q : The perfect price discrimination

    Suppose a monopolist has zero marginal cost and faces the following demand curve D(p) = 10 - 2p (a) Graph the demand curve, the marginal revenue curve, and the rm's margin

  • Q : Expected Rate of Inflation What is the

    What is the Expected Rate of Inflation. Illustrate the term.

  • Q : Direction of the income effect The

    The direction of the income effect can’t be: (i) Negative for inferior goods. (ii) Positive for the luxury goods. (iii) Zero for a good which some people consider a requirement. (iv) Expected when we know only the size and direction of substitution effect.

  • Q : Pretax -posttax and transfer

    Refer to the following diagram. If line b represents the pretax and transfer distribution of income in the United States, we would expect the post-tax and transfer distribution to be: A) line a. B) line b, because taxes and transfers have no effect on income distribut

  • Q : Cost structure characteristic in purely

    When Cling Peach Orchards has a cost structure characteristic of peach orchards into this purely competitive industry, when the long run new competitors would most likely enter the market providing the wholesale price per bushel of peaches exceeded: (

  • Q : Determine income elasticity of demand

    This given figure as in below demonstrates how the consumption of goods A, B, C and D differs as a family’s income changes. There income elasticity of demand equivalents 1 for: (w) good A. (x) good B  (y) good C. (z) good D