--%>

Average variable cost curve of firm

Can someone specify correct answer of the given query of demonstrated figure in below that curve J is that cranberry of: (w) industry’s supply curve. (x) firm’s demand curve. (y) firm’s average variable cost curve. (z) firm’s short-run supply curve.

1939_demand and supply.png

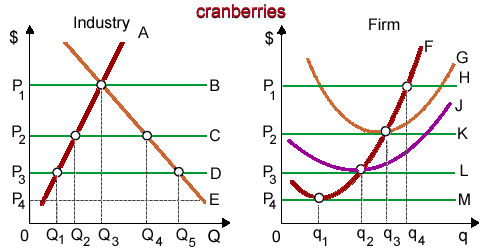
Please choose the right answer for the same..

   Related Questions in Microeconomics

  • Q : Perfect elasticity of demanded curve

    The graph of a demand curve which is perfectly elastic is: (1) positively sloped. (2) horizontal. (3) vertical. (4) negatively sloped. (5) a 45° diagonal line. Can someone explain/help me with

  • Q : History of Industrial Unions I have a

    I have a problem in economics on History of Industrial Unions. Please help me in the following question. Industrial unions historically tried to systematize all the workers in: (i) A Specific Company or broad industry. (ii) The United States. (iii) A specific craft or

  • Q : Problem on Market Power and Demand for

    Can someone help me in finding out the right answer from the given options. Imperfect competition in the product markets outcomes in: (i) Less labor hired than when product markets were competitive. (ii) Above the equilibrium wages being paid by the monopolists. (iii)

  • Q : Problem on reducing Complementary Goods

    The failure of spaghetti crop would be most probable to decrease the: (1) Supply of cheap red wine. (2) International rate of inflation. (3) Demand for potato salad. (4) Demand for the spicy tomato sauce. (5) Prices of dinners in an Italian restaurant.

    Q : Barriers to entry of dominated industry

    An industry dominated by small huge firms shielded through barriers to entry is: (1) a monopoly. (2) a vertically integrated industry. (3) an oligopolistic industry. (4) an aggregated industry. (5) a cartel. I need

  • Q : Explain Production Possibility curve

    Elucidate Production Possibility curve with the help of a diagram? Answer: The Production Possibility Curve refers to a curve that shows various production possibil

  • Q : Market supply Schedules for a good The

    The market supply schedule for a resource or good shows the: (i) Points in time if production is scheduled for completion. (ii) Amounts sellers wish could be given at prices exceeding the costs. (iii) Maximum quantities which will be offered for sale at particular pri

  • Q : Percentage changes in quantity supplied

    The price elasticity of supply can be very approximately computed as the percentage change within: (w) responsiveness of price to variations within the quantity supplied. (x) quantity divided through the intercept coefficient of the supply curve. (y)

  • Q : Illustration of least price elastic in

    The least price elastic within supply of the given items would be: (w) Ferrari racing cars. (x) tool kits imported by China. (y) wheat. (z) original Picasso drawings. I need a good answer on the topic of Ec

  • Q : Distorted competitive workings of the

    The competitive workings of the market for soy beans would be distorted when: (1) Europe experiences a severe drought and has paltry harvests this year. (2) Ethiopia imports soy beans to feed its hungry masses. (3) the U.S. imposes a soy bean embargo forbidding export