--%>

Average retail price and the consumer Price Index

Table illustrates the average retail price of milk and the Consumer Price Index from the year 1980 to 1998.

42_Average retail price and the consumer Price Index.png

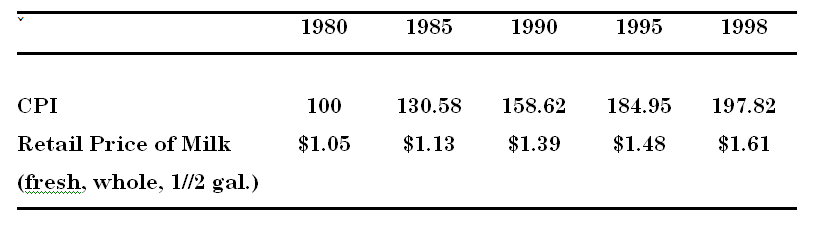
Compute the real price of milk in the year 1980 dollars. Has the real price increased/decreased/stayed the similar since the year 1980?
Real price of milk in year X =CPI1980 /CPI year X nominal price in year 1980

                    1980 $1.05        1985 $0.86            1990 $0.88     1995 $0.80  1998 $0.81

Since 1980 the real price of milk has reduced.


   Related Questions in Microeconomics

  • Q : Ordinal utility In economics, what is

    In economics, what is ordinal utility and what are its assumptions

  • Q : Problem Based on Economic Rent Location

    Location or site rents are as: (w) unrelated to the geographic location of a firm in a market. (x) determined from the fertility of land. (y) generated while a firm’s location allows this to charge more for its output or to pay less for its inpu

  • Q : Selling footballers-the economic

    State economic arguments on whether a football club must sell a significant player?

  • Q : Limit pricing model of strategic

    The assumption essential for the result of the limit pricing model of strategic behavior is: (a) entrant firms price at marginal cost. (b) entry and exit is relatively costless. (c) the incumbent firms will maintain old output levels after entry of a

  • Q : Types of output for producing goods

    Kinds of output subsequently used to generate other goods are termed as: (w) land. (x) labor. (y) capital. (z) primary resources. Hey friends please give your opinion for the problem of Eco

  • Q : Managerial Economics-Error of omission

    Can someone please help me in finding out the precise answer from the following question. The ‘error of omission’ takes place when: (1) Managers pursue policies which outcome in layoffs. (2) Corporations vend more stock than is really available. (3) Manage

  • Q : Demand and supply conditions in the

    Refer to the following diagram, which depictes demand and supply conditions in the competitive market for product X. A shift in the demand curve from D0 to D1 might be caused by a(n): 1) decrease in income if X is an inferior good. 2) increase in the price of compleme

  • Q : Slopes of demand and supply curves The

    The slopes of demand and supply curves are frequently: (w) misleading as guides to price elasticities. (x) independent of the units measuring changes in price and quantity. (y) highly dependent upon each other. (z) used to forecast changing consumer t

  • Q : Type of model used by economists Which

    Which type of model is used by the economists to analyze competitive market?

  • Q : Profit maximizing strategy Prohibition

    Prohibition Corporation would exactly break-even on its St. Valentine’s Day software when, in place of correctly identifying its profit maximizing strategy, this: (1) operated at point i, charging just $20 per copy and producing