--%>

Analytic time and profit maximization

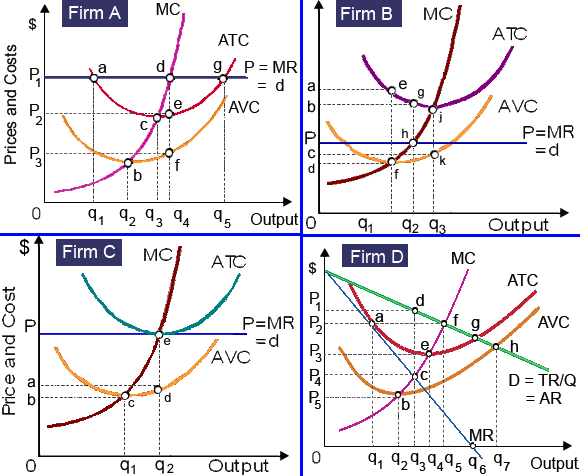
Firm A in below illustration of figure maximizes profit and is: (1) demonstrated as operating in the long run. (2) capable of reaping economic profit of P2P1de, since only in the short run. (3) incurring economic losses equivalent to fixed costs of P3P2ef. (4) earning normal accounting profits, although only when it operates efficiently. (5) producing output level q5 to maximize total revenue.

1317_Market Structures.png

Can anybody suggest me the proper explanation for given problem regarding Economics generally?

   Related Questions in Microeconomics

  • Q : Problem regarding borrowing from

    The main source of external funding employed when major American corporations contain expanded their operations in the precedent three decades has been: (1) Borrowing from commercial banks. (2) Selling the record amounts of latest corporate stock. (3) Borrowing via is

  • Q : Problem on Right-to-Work Laws In states

    In states that encompass ‘Right to Work’ laws, then collective bargaining agreements: (i) Can’t need all employees to join a union in a specified period after being hired. (ii) Generally state the number of employees a firm

  • Q : Market shifting while supply fallen and

    Specified the shifts demonstrated in the market for peanuts, there is the: (1) price will fall.(2)  quantity of output will rise slightly. (3) supply has fallen while demand has grown. (4) main adjustment happens in the quantity exchanged. (5) va

  • Q : Rational consumer-Relative Prices I

    I have a problem in economics on rational consumer-Relative Prices. Please help me in the following question. The rational consumer purchasing decisions depend mainly on: (1) Current market prices. (2) Absolute prices. (3) Nominal prices. (4) Monetary prices. (5) Rela

  • Q : Effected income of a small changes The

    The income effect of a small change in wage rate in demonstrated figure of Glynn dominates the substitution effect at: (1) point a. (2) point b. (3) point c. (4) point d. (5) every point specified in the figure.

  • Q : Consumer behaviour Graphical

    Graphical representation of relationship between MPC and multiplier?

  • Q : Problem on Hicks model of collective

    The model of collective bargaining designed by the John Hicks graphically resolves for the level of: (i) Wage rate and length of strike. (ii) Fringe advantages and safety cases on the job. (iii) Wage rates and union dues. (iv) Union control over the w

  • Q : Determine produce economic profit When

    When point e corresponds to $9,000 per RoboMaid, Robomatic can produce economic profit all month of at most around: (1) $25 million. (2) $40 million. (3) $55 million. (4) $70 million. (5) $85 million.

    Q : Comparative statics and consumer demand

    Explain the methodological procedure called comparative statics.  What does this procedure imply regarding the nature of the consumer demand curve?

  • Q : Supply of curve in the short run I have

    I have a problem in economics on Supply of curve in the short run. Please help me in the following question. The supply curve of milk would shift in the short-run in response to the modification in: (i) Price of the milk. (ii) Demand for the milk. (iii) Numbers and si