--%>

Absolute and Complete Inequality

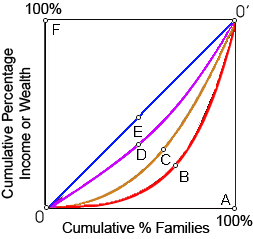
Absolute and complete inequality into the distribution of income or wealth would be reflected within the Lorenz curve demonstrated as: (i) line 0A0'. (ii) line 0B0'. (iii) line 0C0'. (iv) line 0D0'. (v) line 0F0'.

1321_Problem on Lorenz Curve1.png

Hey friends please give your opinion for the problem of Economics that is given above.

   Related Questions in Microeconomics

  • Q : Minimum value of investment multiplier

    Minimum value of investment multiplier: Investment multiplier K=1/1-mpcWhen mpc = 0 then K=1/1-0 = 1 that is the minimum value of investment multiplier

  • Q : Gross Domestic Product of Norway What

    What do you mean by Gross Domestic Product of Norway?

  • Q : Long run equilibrium price When

    When Christmas tree farming is a decreasing cost industry and this firm is typical, in that case an increase in the market demand for Christmas trees will give in a long run equilibrium price: (1) greater than P1. (2) less

  • Q : Compare average household income How

    How you compare the average household income of the different countries?

  • Q : Maximizing utility from consumption of

    Given that a MU of French fries of 35 utils and a MU for the serving of potato chips at 25 utils, when their respective prices are $1.50 and $.80, a person who wishes to maximize the utility from the consumption of both of such goods would consume: (1) The similar amo

  • Q : Problem on shortages or surpluses of

    The market is cleared when there are: (i) Buyers left waiting in line. (ii) Surplus supplies of unsold goods. (iii) No surpluses or shortages. (iv) Tendencies for the prices to increase. Can someone please help me in finding out th

  • Q : Demand curve for peanuts Question: a)

    Question: a) Johnny consumes peanuts (x1) and a composite good (x2). His utility function is U = x1x2. His marginal utilities are MU1 = x<

  • Q : Where is the price elasticity of supply

    The price elasticity of supply as in below demonstrated figure is unitary within: (w) Panel A. (x) Panel B. (y) Panel C. (z) Panel D.

    Q : Numerical question regarding demand At

    At $1.50 per gallon, Alana purchases 50 gallons of gasoline weekly, Bart purchases 20 gallons weekly, and Caitlin purchases 20 gallons weekly. One point on their joint demand curve for gasoline would be Q =: (1) 90 gallons per week, P = $1.50. (2) 90 gallons per week,

  • Q : Define investment demand function

    Investment demand function: Investment demand function is the relationship among rate of interest and investment demand. There is an inverse relationship among the rate of interest and investment demand. High inter